Aandeel BasWare | Filter Basic-Info
Aandeel: BasWare (Finland large caps), ISIN: FI0009008403
| Koers | 15.08 | Hoogste koers | 18.32 |
| Laagste koers | 14.82 | 1-jrs rend. | 0.00 |
| Sector | Financials | Subsector | Financiële diensten |
| Jaarverslag 2014 |
Contactinformatie:Staat: Cello-rakennus, Linnoitustie 2Postbox: 2600Stad: EspooLand: FinlandTelefoon: 358-9-879171Website: www.basware.comCEO: Esa TihilaCFO: Niclas Rosenlew
Sectorvergelijking BasWare
| Jaar | Omzet | Totaal omzet sector | Marktaandeel |
|---|---|---|---|
| 2019 | 0 | 88,778,030,565 | 0.00 % |
| 2020 | 0 | 87,398 | 0.00 % |
| 2021 | 0 | 96,976 | 0.00 % |
| 2022 | 0 | 112,383 | 0.00 % |
| 2023 | 0 | 124,474 | 0.00 % |
Adviezen BasWare
No Records Found
Nieuws BasWare
No Records Found
Rapporten BasWare
| 2017 | 2018 | 2019 | 2020 | 2021 |
|---|---|---|---|---|
Profiel BasWare
|
||||||||||||||||||
| ||||||||||||||||||
|
De belangrijkste details rondom het aandeel BasWare nemen we hier door. We nemen hier in een snapshot:
BasWare is een financiële bedrijf uit Nederland. Andere spelers in deze sector zijn onder andere Hong Kong Exchanges and Clearing, Huarong International Financial Holdings, If Bancorp Inc en Trendlines Group.
Alle jaarverslagen van het bedrijf bieden wij op deze pagina aan. De hoofdzetel van het bedrijf staat in Espoo.
Het bedrijf had eind 2019 rond de duizend FTE in dienst.
Waarderingen en dividenden aandeel BasWare
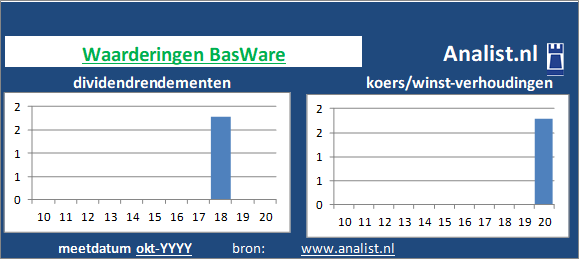
2020 positief voor BasWare-beleggers
Rendementen aandeel BasWare
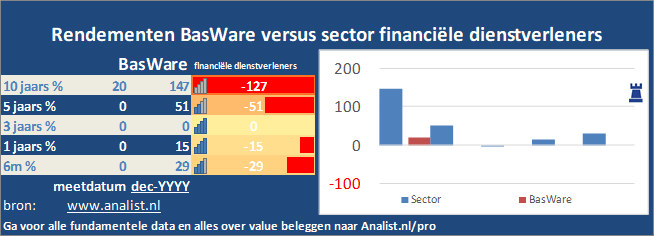 De periode 2015-2020 is tot nu toe een beroerde periode voor beleggers gebleken. De mondiale financials won circa 62 procent in het afgelopen decennium. Sinds 2015 staat de sector 15 procent hoger en over het voorbije jaar (augustus 2019 - augustus 2020) staat BasWare's peergroup op 1 procent verlies.
 Op basis hiervan kunnen het aandeel een microcap aandeel noemen.
Op de beurs was medio 2020 het financiële bedrijf op de beurs rond de 0 miljoen euro waard.
Resultaten BasWare
| Resultaten |
2021
|
2022
|
2023
|
2024
|
2025
|
|---|---|---|---|---|---|
| Omzet |
|
|
|
|
|
| Kosten |
|
|
|
|
|
| Nettowinst |
|
|
|
|
|
| Winstmarge |
|
|
|
|
|
| ROI |
|
|
|
|
|
Balans BasWare
| Balans |
2021
|
2022
|
2023
|
2024
|
2025
|
|---|---|---|---|---|---|
| Eigen vermogen |
|
|
|
|
|
| Vreemd vermogen |
|
|
|
|
|
| Totaal vermogen |
|
|
|
|
|
| Solvabiliteit |
|
|
|
|
|
| Cash |
|
|
|
|
|
| Kasstroom |
|
|
|
|
|
| Werknemers |
|
|
|
|
|
| Omzet per werknemer |
|
|
|
|
|
| Kasstroom / vreemd vermogen |
|
|
|
|
|
Details BasWare
| Details |
2016
|
2017
|
2018
|
2019
|
2020
|
|---|---|---|---|---|---|
| Koers |
0.0
|
0.0
|
0.0
|
0.0
|
15.08
|
| Winst per aandeel |
0.0
|
0.0
|
0.0
|
0.0
|
|
| Koers / winst-verhouding |
0.0
|
0.0
|
0.0
|
0.0
|
|
| Dividend |
0.0
|
0.0
|
0.0
|
0.0
|
|
| Dividend % |
0.00 %
|
0.00 %
|
0.00 %
|
0.00 %
|
|
| Payout % |
0.0
|
0.0
|
0.0
|
0.0
|
|
| Boekwaarde |
0.0
|
0.0
|
0.0
|
0.0
|
|
| Boek / koers |
0.0
|
0.0
|
0.0
|
0.0
|
|
| Kasstroom per aandeel |
0.0
|
0.0
|
0.0
|
0.0
|
|
| Aandelen |
0
|
0
|
0
|
0
|
|
| Marktkap. |
0,00
|
0,00
|
0,00
|
0,00
|
|
Dividend BasWare
Koersinfo BasWare
|
Datum
|
Koers
|
|---|---|
|
23 mei
|
15.08
|
|
01 mei
|
14.82
|
|
28 apr
|
15.42
|
|
21 apr
|
17.64
|
|
14 apr
|
18.32
|
|
28 jan
|
16.20
|