Aandeel Vonovia | Filter Basic-Info
Aandeel: Vonovia (Duitsland small caps), ISIN: DE000A1ML7J1
| Koers | 21.12 | Hoogste koers | 28.73 |
| Laagste koers | 20.96 | 1-jrs rend. | -42.73 |
| Gem. Koersd. | 33.32 | Ver. Rend. | 57.77 % |
| Sector | Financials | Subsector | Onroerend goed |
| Verkopen | 0 | Rating |

|
| Houden | 2 | Consensus |
|
| Kopen | 3 | ||
| Jaarverslag 2016 |
Sectorvergelijking Vonovia
| Jaar | Omzet | Totaal omzet sector | Marktaandeel |
|---|---|---|---|
| 2019 | 7,223 | 221,688 | 3.26 % |
| 2020 | 7,111 | 202,518 | 3.51 % |
| 2021 | 11,321 | 259,926 | 4.36 % |
| 2022 | 5,418 | 290,336 | 1.87 % |
| 2023 | 5,002 | 280,372 | 1.78 % |
Adviezen Vonovia
Nieuws Vonovia
Omzetstijging Vonovia aldus consensus analisten, relatief hoog dividend
Analisten verwachten over 2017 dalende omzet Vonovia, hoog dividendrendement
Extreem dividendrendement Vonovia
Rapporten Vonovia
| 2017 | 2018 | 2019 | 2020 | 2021 |
|---|---|---|---|---|
Profiel Vonovia
|
||||||||||||
| ||||||||||||
|

Vonovia's belangrijkste variabelen nemen we hier door. Samengevat:
Het Duitse kennen we vooral van haar activiteiten in de vastgoedsector.
Homeowners Choice, Ansal Properties and Infrastructure, IRC Properties Inc en California BanCorp zijn andere (internationale) spelers in deze sector. Vonovia's hoofdkantoor is in Unable To Collect Data For The Field 'Tr.Headquarterscity' And Some Specific Identifier(S)..
Alle financiele rapporten van het concern staan hier.
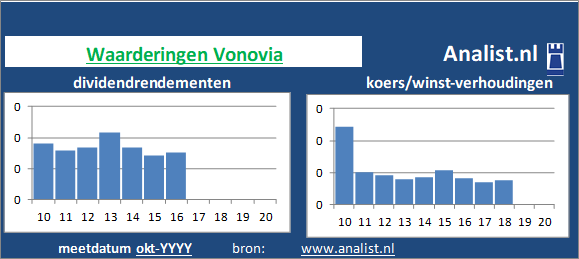
Waarderingen en dividenden aandeel Vonovia
Rendementen aandeel Vonovia
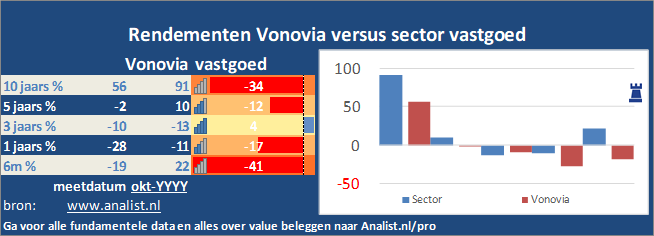 Over het afgelopen decennium won de vastgoedsector circa 53 procent. Sinds 2015 staat de sector 2 procent hoger en over het voorbije jaar (augustus 2019 - augustus 2020) staat Vonovia's peergroup op 13 procent verlies.
 Resultaten Vonovia
| Resultaten |
2021
|
2022
|
2023
|
2024
|
2025
|
|---|---|---|---|---|---|
| Omzet |
|
|
|
|
|
| Kosten |
|
|
|
|
|
| Nettowinst |
|
|
|
|
|
| Winstmarge |
|
|
|
|
|
| ROI |
|
|
|
|
|
Balans Vonovia
| Balans |
2021
|
2022
|
2023
|
2024
|
2025
|
|---|---|---|---|---|---|
| Eigen vermogen |
|
|
|
|
|
| Vreemd vermogen |
|
|
|
|
|
| Totaal vermogen |
|
|
|
|
|
| Solvabiliteit |
|
|
|
|
|
| Cash |
|
|
|
|
|
| Kasstroom |
|
|
|
|
|
| Werknemers |
|
|
|
|
|
| Omzet per werknemer |
|
|
|
|
|
| Kasstroom / vreemd vermogen |
|
|
|
|
|
Details Vonovia
| Details |
2016
|
2017
|
2018
|
2019
|
2020
|
|---|---|---|---|---|---|
| Koers |
28.97
|
38.80
|
37.11
|
45.00
|
56.02
|
| Winst per aandeel |
4.63
|
4.74
|
4.20
|
2.02
|
5.50
|
| Koers / winst-verhouding |
6.26
|
8.19
|
8.84
|
22.28
|
3.84
|
| Dividend |
1.05
|
1.24
|
1.35
|
1.47
|
1.58
|
| Dividend % |
3.62 %
|
3.20 %
|
3.64 %
|
3.27 %
|
7.48 %
|
| Payout % |
0.23
|
0.26
|
0.32
|
0.73
|
0.29
|
| Boekwaarde |
27.10
|
31.08
|
34.17
|
35.11
|
40.00
|
| Boek / koers |
0.94
|
0.80
|
0.92
|
0.78
|
1.89
|
| Kasstroom per aandeel |
1.67
|
1.83
|
2.05
|
2.69
|
2.37
|
| Aandelen |
497
|
517
|
553
|
578
|
604
|
| Marktkap. |
14.400,81
|
20.077,78
|
20.508,69
|
26.030,52
|
12.748,98
|
Dividend Vonovia
Koersinfo Vonovia
|
Datum
|
Koers
|
|---|---|
|
23 mei
|
21.12
|
|
01 mei
|
22.91
|
|
28 apr
|
23.10
|
|
21 apr
|
23.51
|
|
14 apr
|
23.09
|
|
01 apr
|
21.56
|
|
30 maa
|
21.04
|
|
28 maa
|
21.04
|
|
25 maa
|
20.96
|
|
24 maa
|
21.00
|
|
19 maa
|
21.61
|
|
17 maa
|
24.66
|
|
10 maa
|
24.97
|
|
08 maa
|
25.80
|
|
03 maa
|
26.72
|
|
24 feb
|
27.55
|
|
10 feb
|
25.09
|
|
06 feb
|
24.83
|
|
04 feb
|
24.19
|
|
28 jan
|
24.45
|
|
26 jan
|
24.21
|
|
21 jan
|
24.02
|
|
17 jan
|
25.23
|
|
13 jan
|
25.31
|
|
21 dec
|
24.00
|
|
18 dec
|
24.05
|
|
17 dec
|
23.89
|
|
16 dec
|
23.72
|
|
15 dec
|
24.20
|
|
11 dec
|
23.96
|